June 20, 2025
%20(1).jpg)
In the contemporary commercial landscape, wireless connectivity has transcended its status as a convenience to become the "fourth utility." Standing alongside electricity, water, and HVAC, reliable cellular coverage is now a fundamental requirement for building occupancy. Yet, despite this shift, businesses nationwide lose millions in productivity annually due to a single, invisible adversary: the dead zone.
With approximately 80% of all mobile traffic originating indoors, the traditional strategy of relying on outdoor cell towers to penetrate modern building envelopes is failing. Energy-efficient construction materials—specifically Low-E glass, steel reinforcement, and high-density concrete—act as effective Faraday cages, blocking macro network signals and isolating your workforce.
Dropped calls in the boardroom are an annoyance; lost telemetry data in a hospital or disconnected inventory scanners in a warehouse are operational liabilities.
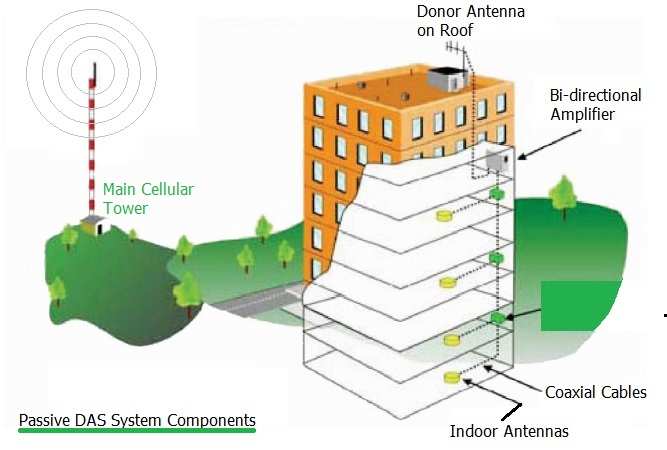
At Metro Wireless, we do not guess when it comes to connectivity. We engineer it. This comprehensive guide details our rigorous, four-phase Distributed Antenna System (DAS) methodology, designed to transform cellular dead zones into assets of productivity and safety.
Starting an infrastructure project without a precise roadmap is a recipe for spiraling costs and delayed timelines. Because a DAS is a capital-intensive infrastructure investment, Metro Wireless begins with a phase of rigorous financial and structural planning before a single cable is run.
Our engineering team begins by ingesting the "DNA" of your facility. We require more than just a floor plan; we need to understand the building's physics.
This "homework" allows us to spot installation challenges early—such as fire-rated walls that require specialized penetrations or plenum air spaces—preventing costly change orders later in the project.
We conduct a deep-dive intake to align the system with your specific business goals. A DAS is not a one-size-fits-all solution.
Based on this data, we generate a ROM BOM. This is your hardware "first draft," listing the donor antennas, Bi-Directional Amplifiers (BDAs), fiber hubs, and coaxial cabling required. Unlike a simple quote from a hardware distributor, our proposal includes construction collaboration. Our in-house construction managers validate mounting points and aesthetic requirements upfront, ensuring the budget you see is the budget you pay.
Is your building code-compliant? New fire codes often mandate public safety signal testing. Contact Metro Wireless for a regulatory signal audit today.

Once the budget is approved, we move from estimation to simulation. Metro Wireless utilizes iBwave, the global standard for in-building network design, to create a digital twin of your facility. This software allows us to model radio frequency (RF) propagation with pinpoint accuracy.
A common misconception is that "more bars" equals better service. In RF engineering, bars are arbitrary. We model three specific metrics to guarantee performance:
We assign RF attenuation values to every wall and window in the digital model. We then place virtual antennas and simulate how the signal will propagate through those materials.
The Outcome: A "Right-First-Time" technical package containing coverage maps, link budgets, and precise equipment schematics.

Predictive models are powerful, but they must be validated by physics. Our on-site survey team brings the design to life with enterprise-grade spectrum analyzers and scanning receivers.
A DAS is only as good as the signal it captures. Our technicians access the rooftop to characterize the "donor" signal from nearby cell towers.
We conduct a systematic "Grid Test" of your facility. The floor plan is divided into grid cells (typically 1,600 sq. ft.), and a technician walks the site taking live measurements in each cell.
We physically verify the cable routes designed in Phase 2. This includes coordinating roof penetrations (maintaining warranties) and verifying that cable runs to the MDF/IDF closets stay within the 300-foot limit for coaxial copper. For longer runs, we pivot the design to utilize fiber-optic, active DAS components to eliminate signal loss over distance.
Armed with validated data, we finalize the proposal. This is not just an invoice; it is a project roadmap including an ROI analysis, final equipment lists, and a guaranteed installation timeline.
Our deployment teams are specialists in low-voltage and RF integration. We understand that in a corporate or healthcare environment, aesthetics and safety are paramount.
Once powered on, the system is "tuned." A critical part of this phase is managing Macro Dominance. If the signal inside your building is weaker than the signal from the tower outside, your phone will constantly switch between the two, draining your battery and dropping calls. We adjust the DAS gain to ensure it "dominates" the environment, keeping devices locked onto the clean, internal signal. Learn more about installing a DAS solution from our experts.

While the technology remains consistent, the application of DAS varies significantly by industry. Metro Wireless tailors designs to meet these unique vertical demands.
In hospitals, connectivity is a life-safety issue. Telemetry monitors, VoLTE nurse communication systems, and Electronic Health Records (EHR) on tablets require 99.999% reliability.
Modern distribution centers rely on real-time inventory management via handheld scanners and autonomous forklifts.
For Class-A office space, connectivity is a tenant retention tool.
Investing in a DAS is a long-term decision. Metro Wireless designs systems that are ready for the next decade of wireless innovation.
Carriers are aggressively rolling out 5G on the C-Band (3.7–3.98 GHz). These higher frequencies offer incredible speed but have poor building penetration compared to legacy 4G. Metro Wireless specifies hardware—like the Nextivity Cel-Fi QUATRA—that is hardware-ready for these frequencies, ensuring your investment doesn't become obsolete next year.
For enterprises seeking total control, we can design DAS infrastructure that supports Private LTE on the CBRS (Citizens Broadband Radio Service) spectrum. This creates a secure, private "cellular lane" for your critical IoT devices and robotics, completely separate from the public carrier traffic. Read our guide on private cellular networks for more benefits and use cases.

In an industry crowded with box-shifters, Metro Wireless stands apart as a strategic technology partner. We combine the engineering rigor of a carrier with the agility of a managed service provider.
Connectivity is the foundation of modern business. Build it on solid ground.
Q: What is the difference between a consumer signal booster and an Enterprise DAS?
Consumer boosters are analog amplifiers that boost everything, including noise (interference). They often fail in large buildings. An Enterprise DAS (specifically Active or Hybrid systems like Cel-Fi QUATRA) digitizes the signal, filters out noise, and distributes it via ethernet or fiber, ensuring high-quality data speeds for hundreds of simultaneous users.
Q: How much does an Enterprise DAS cost?
Costs vary based on square footage and wall density. Generally, budget between $0.75 to $1.50 per square foot for a turnkey solution. Factors like high-density concrete, union labor requirements, or Public Safety (fire code) mandates can influence this range.
Q: Does my building legally require a DAS?
For Public Safety, likely yes. Most municipalities now adopt IFC 510 or NFPA 1221/1225 codes, which mandate that new buildings provide radio coverage for fire and police departments. If your building fails a signal grid test, you cannot receive a Certificate of Occupancy without a Public Safety DAS.
Q: Can a DAS support 5G?
Yes. Modern DAS equipment is 5G-ready. However, design matters. 5G frequencies (especially C-Band) do not penetrate walls as well as 4G, so a 5G-capable design may require a higher density of antennas than a legacy system. Compare options in our post on Private LTE vs 5G.
Don't let the "Fourth Utility" become your operational bottleneck. Partner with Metro Wireless for a comprehensive DAS assessment. From iBwave predictive modeling to 24/7 managed support, we deliver the coverage your business demands.
Contact Metro Wireless today to schedule your Discovery Assessment. Let's build a connectivity strategy that moves your business forward.

Tyler Hoffman
CEO
